Just like with other tests such as the z-test or ANOVA, we can conduct hypothesis testing using Pearson�s r.
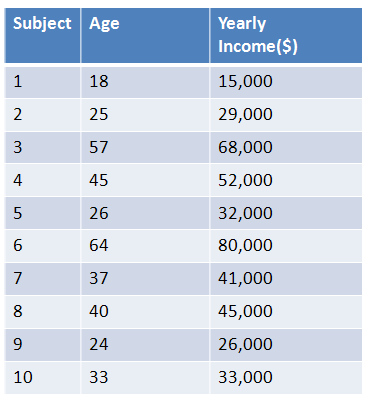
To test if age and income are related, researchers collected the ages and yearly incomes of 10 individuals, shown below. Using alpha = 0.05, are they related?

|
| Figure 1. |
|---|
| Steps for Hypothesis Testing with Pearson's r |
|---|
|
1. Define Null and Alternative Hypotheses 2. State Alpha 3. Calculate Degrees of Freedom 4. State Decision Rule 5. Calculate Test Statistic 6. State Results 7. State Conclusion |
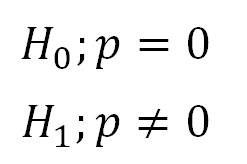
1. Define Null and Alternative Hypotheses

|
| Figure 2. |
|---|
2. State Alpha
alpha = 0.05
3. Calculate Degrees of Freedom
Where n is the number of subjects you have:
df = n - 2 = 10 � 2 = 8
4. State Decision Rule
Using our alpha level and degrees of freedom, we look up a critical value in the r-Table. We find a critical r of 0.632.
If r is greater than 0.632, reject the null hypothesis.
5. Calculate Test Statistic
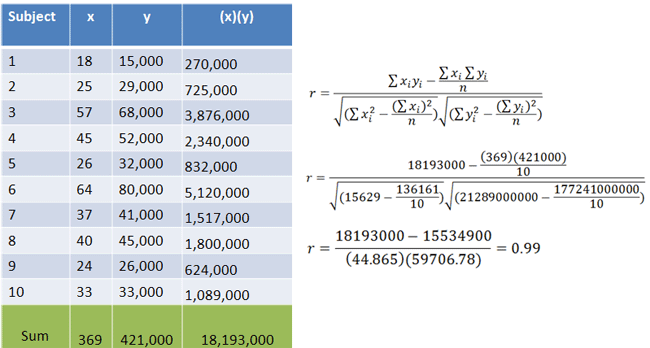
We calculate r using the same method as we did in the previous lecture:

|
| Figure 3. |
|---|
6. State Results
r = 0.99
Reject the null hypothesis.
7. State Conclusion
There is a relationship between age and yearly income, r(8) = 0.99, p < 0.05